In the fall of 2017, History Department Chair Julia Rivellino-Lyons and History Teacher Samuel Chapin began using the iPad application “Equity Maps” in their Honors U.S. History class periods.
The app serves to track the dialogue between members of a group with a special emphasis on gender equity. Equity Maps was built to serve a variety of discussion settings, such as a seminar table, lecture-style classroom, or business meeting. By tapping on each speaker, the user can record the frequency and duration of members’ comments in a discussion.

Deerfield alumna and former history teaching fellow Kayla Corcoran ’09 initially introduced Equity Maps to other Deerfield Teaching Fellows, including Mr. Chapin, who then shared the app with Ms. Rivellino-Lyons. Both teachers felt compelled to incorporate the tool into their classrooms, as they have shared a deep interest in analyzing classroom dynamics for much of their teaching careers.
Ms. Rivellino-Lyons and Mr. Chapin have recorded data for both a typical school day, during which the teacher and students speak in roughly equal amounts, and a graded, almost exclusively student-led discussion called a “round table.” At the conclusion of each “session,” the app offers a wide array of analytic tools to evaluate the discussion. Available features include a playback of the discussion by drawing lines to connect members in the order they spoke, as well as the number of times every student spoke and the average duration of his or her comments.
Melisa Gurkan ’19 praised Equity Maps as a powerful tool for reflection and self-improvement in the classroom. “I myself am someone who talks a lot in class, so after looking at the statistics one day, I would stop myself the next time if I realized that I was talking for too long.” She also noted that this heightened self-awareness encouraged her to improve the experiences of other members in the discussion. “If I recognized that someone was trying to say something but they never got the chance to jump in, I would jump in and ask a question and gear it towards them so they could answer the question and make the point they had,” she recalled.
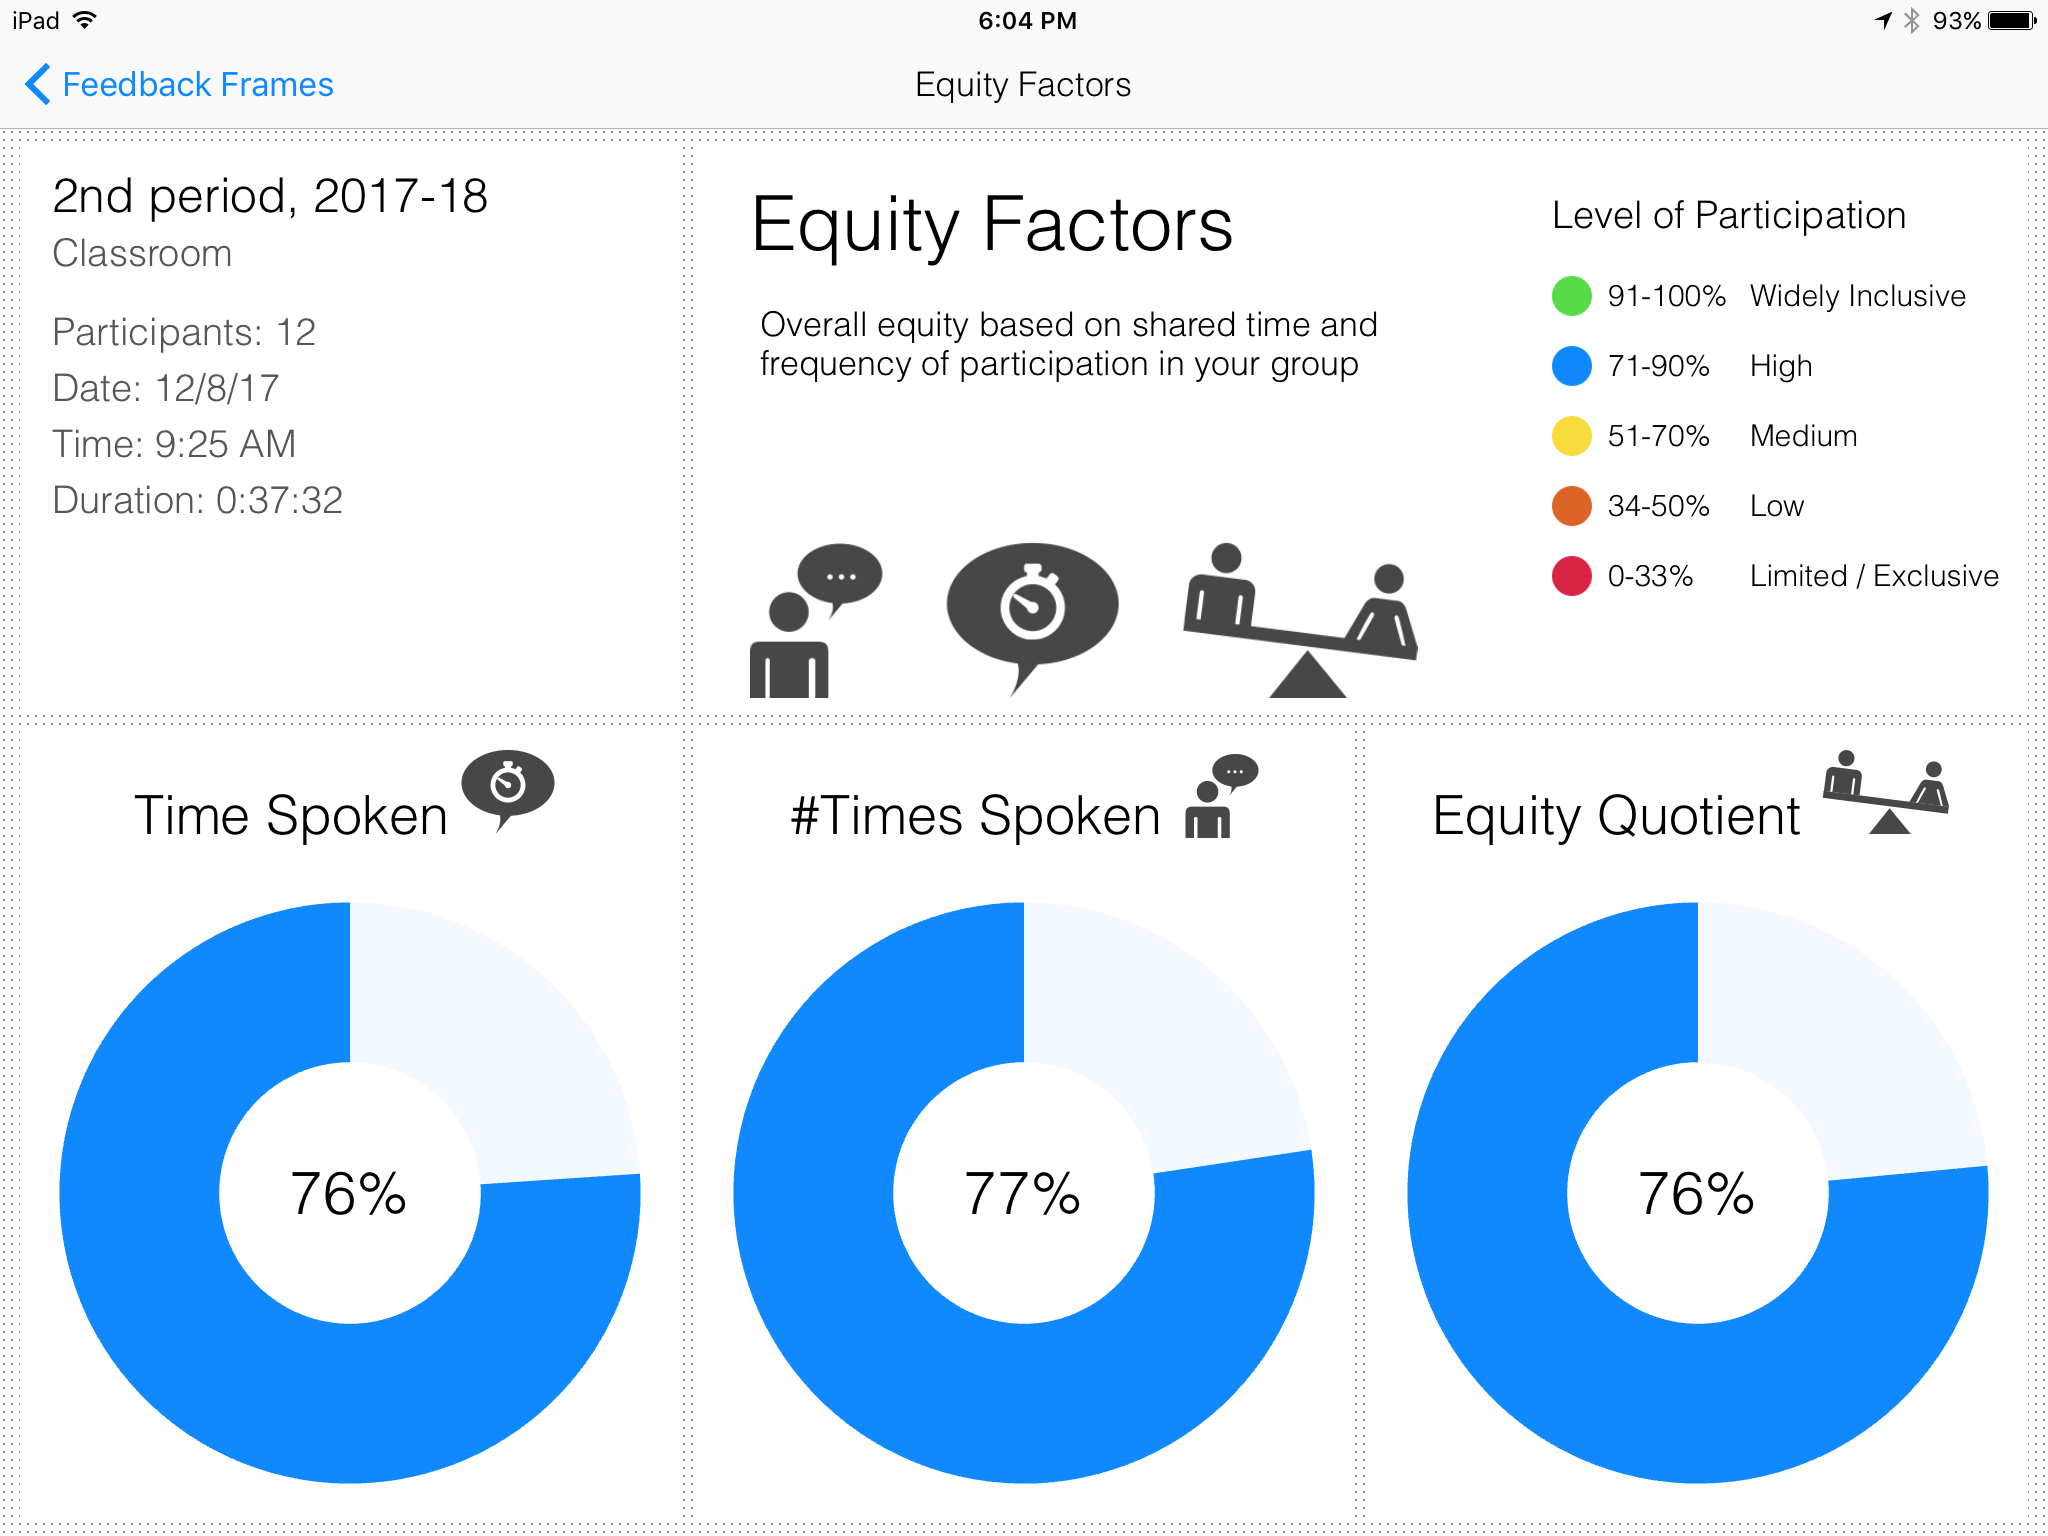
After each discussion, the app also calculates ratios for duration and number of times spoken by gender in addition to “Equity Factors” for the same two sets of data and one “Equity Quotient.” Dave Nelson, Founder of Equity Maps, explained that the Equity Factors are found by calculating the Gini Coefficient, while the Equity Quotient is an average of those two calculations. The Gini Coefficient is an index of measuring inequality, originally used to determine income inequality in a society, which “seemed most suitable for these circumstances” to Nelson.
Equity Maps offers five ratings, from “limited/exclusive” to “widely inclusive,” depending on the balance of speaking time and between boys and girls. Students in Ms. Rivellino-Lyons’s and Mr. Chapin’s classes tend to earn the “High” or “Medium” ratings.
Students have drawn mixed conclusions from the statistics. “I do believe that gender equity in classroom discussions is an issue,” Colin Olson ’19 said. “[The data repeatedly suggests that] the males in our class speak more frequently and longer than their female counterparts, and I would argue that a shift in the class dynamic is a worthy goal to pursue.”
However, Kishor Bharadwaj ’19 acknowledged that internal factors might compromise students’ performance: “I think the majority of students are inclusive and kind. That being said, if you choose not to speak because you are afraid of not having your opinion understood or disrespected due to some external factor such as race or gender, then that is your own prejudice. However, if students of some minority have spoken up and not had their opinion respected, that is a different issue that we need to address as a school.”
Both teachers cautioned against drawing conclusions from this data, as the sample size is small. They also observed that many variables can affect the statistics, such as the discussion topic, personalities of students, or even weather and students feeling sick.
“I’m not sure what [Equity Maps] says about gender roles on campus. The app only shows that there was some discrepancy in participation based on gender during the particular class periods tracked,” said Ms. Rivellino-Lyons. “Equity Maps is not a perfect instrument for assessing participation, but I do think it’s a useful tool for building a group dynamic.”
Mr. Chapin expressed that the greatest strength of the app is promoting how to interact thoughtfully with the Deerfield community: “We live in a world in which structural injustice exists, and in order to fairly and honestly engage with that world, we need to be educated about the nature of those structures and how that influences us.”
Ms. Rivellino-Lyons introduced Equity Maps at the weekly Chair Symposium. She and Mr. Chapin will also present at a faculty meeting focused on technology use. English Teacher Peter Nilsson, who also serves as the Director of Research, Innovation, and Outreach, highlighted the app in his weekly newsletter, “Educator’s Notebook,” to which hundreds of educators subscribe.
Mr. Chapin believes this data is a natural addition to Deerfield’s efforts towards inclusion: “[The app] is a valuable conversation starter for talking about balance and equity, especially with the attention at Deerfield that I think is being rightly paid to cultural competency. We can always do better to be more aware about how much space we are taking up, especially for those who possess a certain set of identities.”